
overview
PROBLEM
MGIC provides banks and creditors with the insurance that a mortgage will be paid in full. The mortgage industry is heavily regulated and very hard to adjust to due to the rules and methods to learn only through experience.
SOLUTION
Due to the complicated nature of buying a house and insurance in general, the process that the banks and how MGIC fits within that process was never put on paper. It was only known to people with years of experience in the industry.
AUDIENCE
Digital Marketing team, Management, and Marketing directors
ROLES
Data Analyst, Designer
TIME FRAME
The overall project started before I joined the team:
Project Time Frame: 9 months (October 2020 – June 2020)
My Time Frame: 4 months (February 2020 – June2020)
TOOLS
Microsoft Excel, Microsoft Word, Pen, Paper, Adobe Illustrator
research process
Reviewing
I started at MGIC as a part-time intern in January 2020. The first month was mainly getting me acclimated to the process and team at MGIC, while getting some introductions to the projects I would be working on, this journey map being a major one. Though the project started before I came onto the team, so I had some catching up to do regarding the data my team members had already gathered.
The main task of this project was to create a detailed map of what the mortgage process was like for the people applying for the mortgage, where the banks fit into the process, and finally where the mortgage insurance company fits in (which would be MGIC in this case). After getting the gist of the project from my project members, Rebecca Arnell and Julio Morice, they provided me with the research they had already done. Lots of this was done through interviews of the sales representatives, account managers, and customer service and looking through their own thoughts of the journey map as well.
Interviews
While I was still reviewing the previously done research, I sat in on a few interviews led by my project members. These interviews were very informal, mainly just trying to get what the pain points were in the process. Along with that they were getting qualitative data on a detailed level that would later be put into a high-level map.
design
Previous Models
Before I came on, Julio and Rebecca had already mapped out some ideas they had based on their own research analytics. What they wanted from me were fresh eye to look at the data and their models to see if they were on the right track and adjust or create as needed.
They also made sure to tell me that the analytics would take a bit of time. This was due to the amount of data they collected and the complicated nature of the mortgage process in general.
So with their gathered data and models I started to map out what I saw as break points in the process. I would constantly go to them, asking them what certain verbiage meant, how it fit in, why it was done this way, etc. I would like to include images of their models to show mow much I changed and show you how much data there was to review. However most of them include sensitive information (they had more details than my map and sketches), so in order to protect MGIC I haven't included them.
Low fidelity
After getting to a point where I felt I had a high-level map of the whole process I started with sketches. I started with a blueprint of the areas of the map. Then I started to slowly put in data where I felt it fit within the map. Finally, I drew out the whole map and presented it to Julio and Rebecca.


Blueprinting the Journey Map

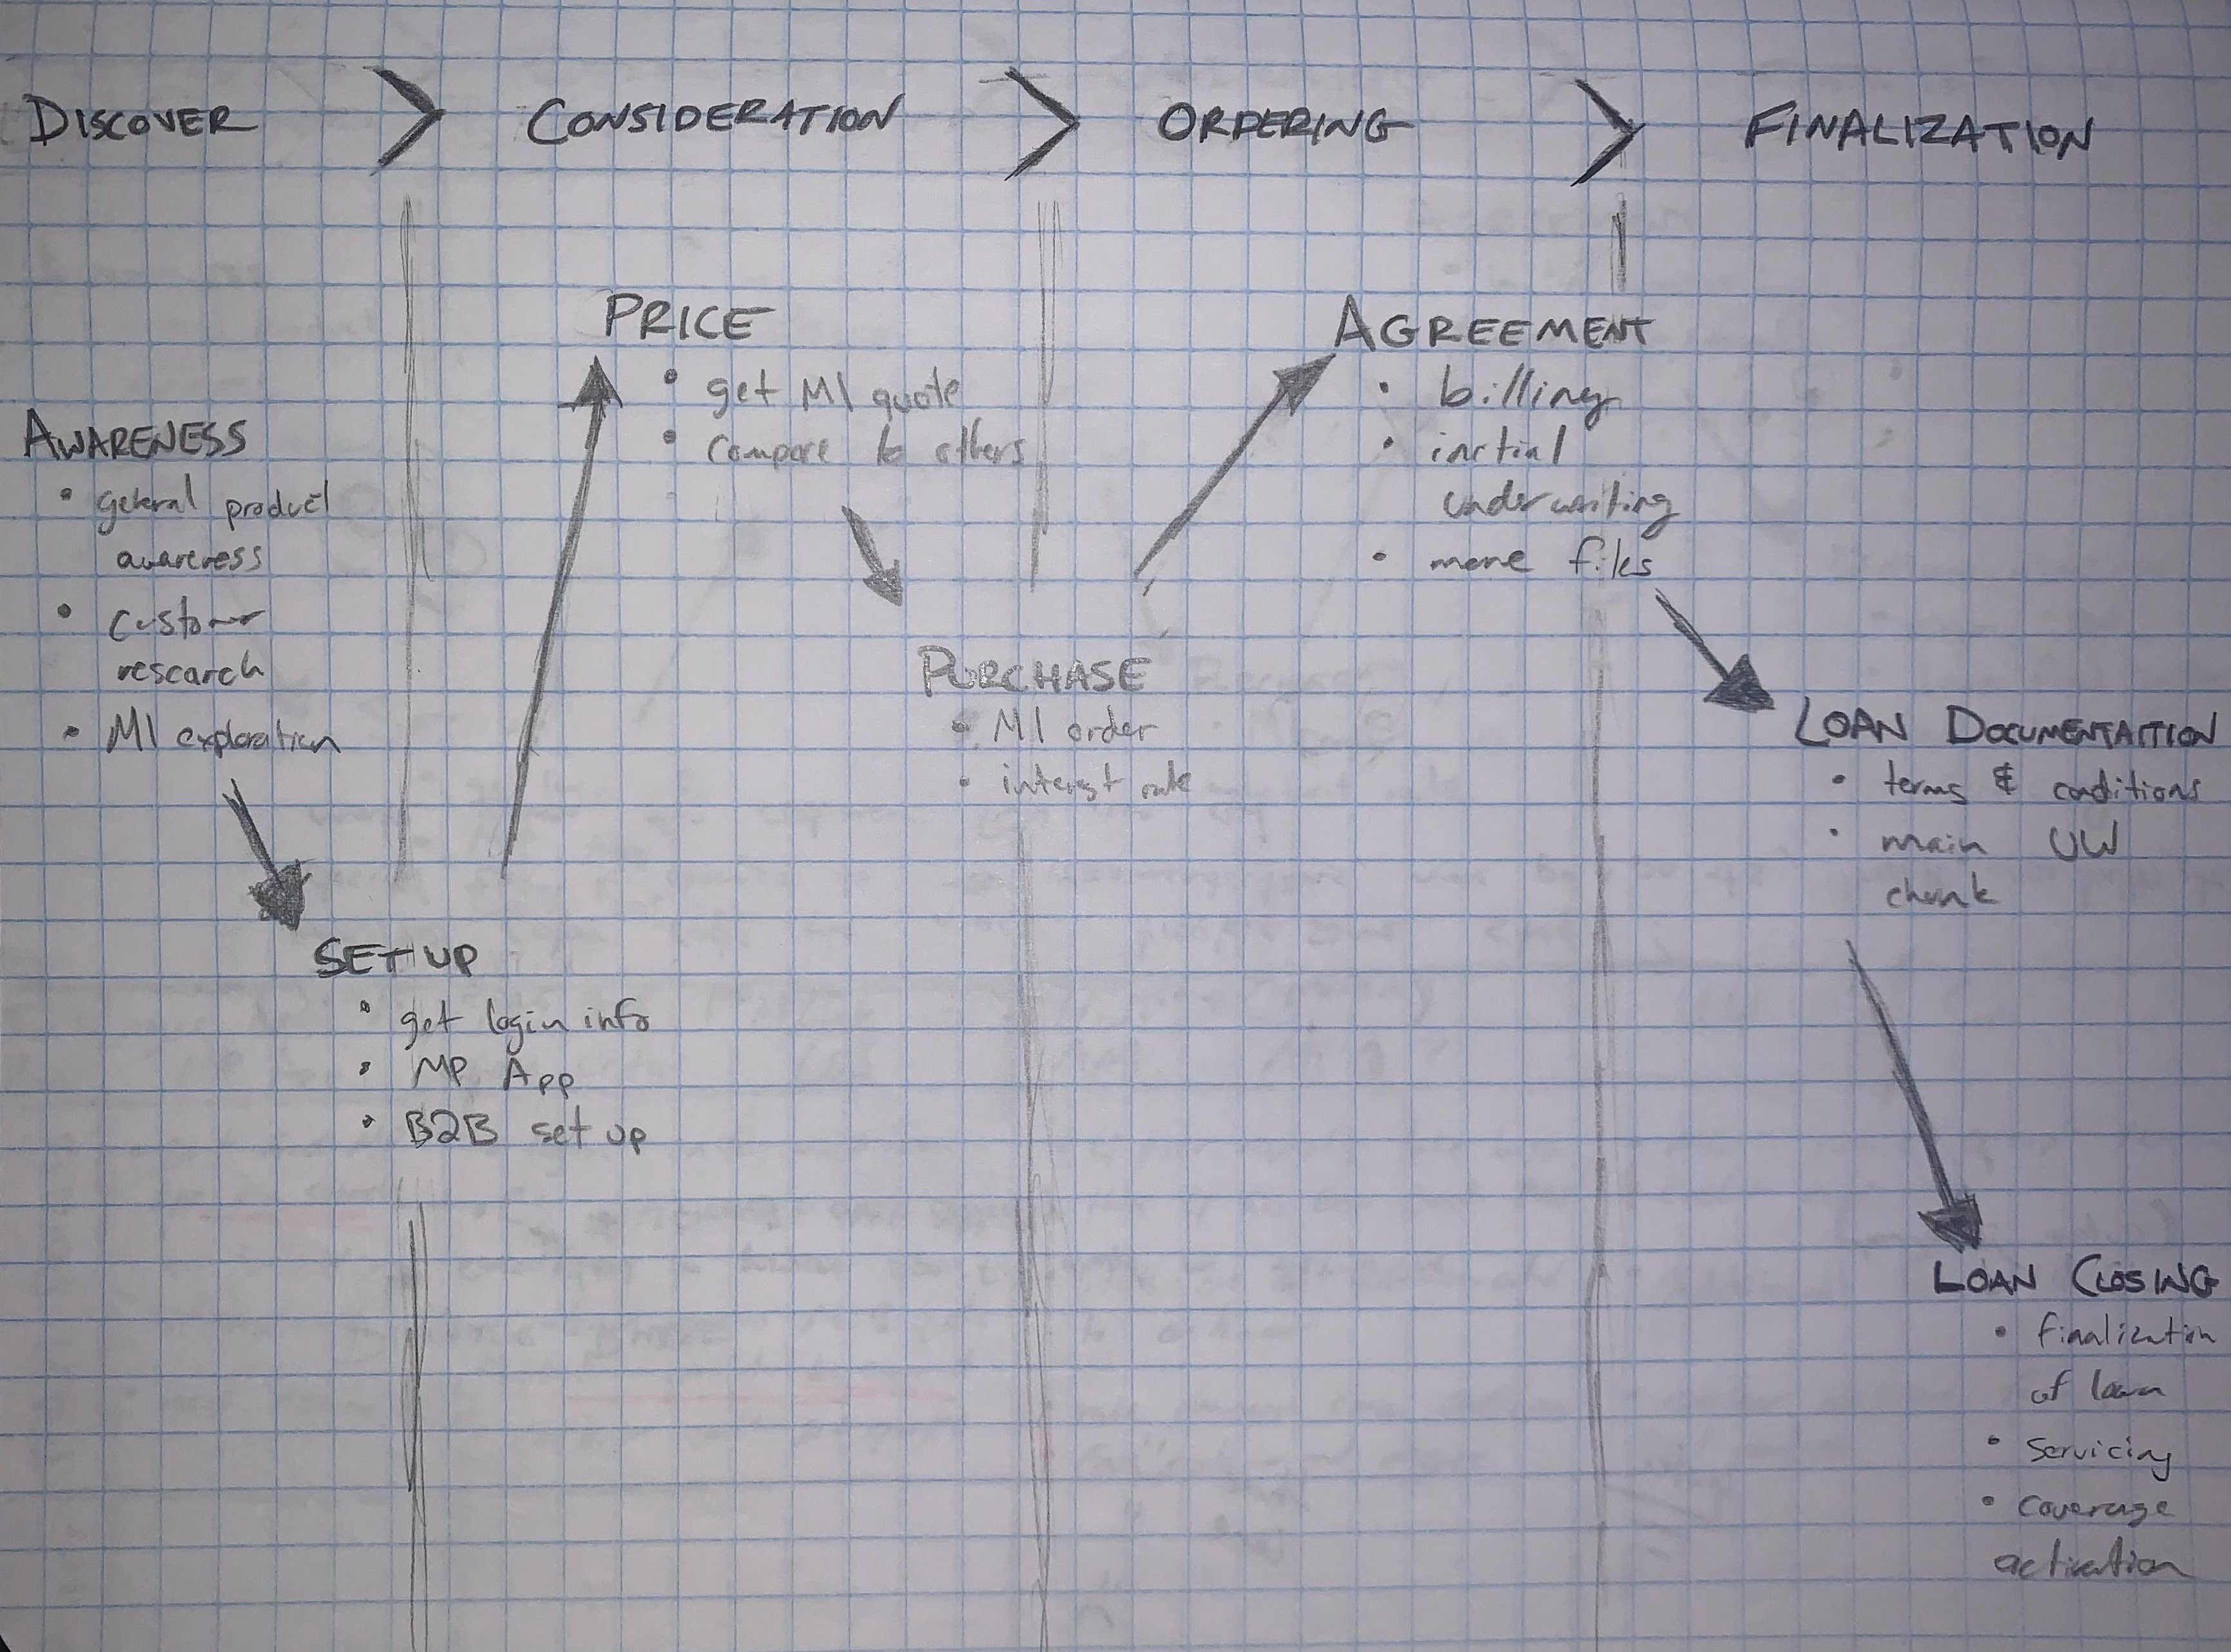
Adding data and dividng phases

Final Lo-Fi Journey Map
They liked the direction I was going, and said it made lots of sense. Both of them also pointed out that the arrow design led viewer to see what high and low points of the journey. This was something that I didn’t even think of since I was focused on making sure the overall journey data was correct. That feedback was incredibly helpful to the final design. They also mentioned that since this was high level, it was open to getting more detailed in future more detailed iterations. With some minor tweaks to which data in the final sketch, I was able to start on the high-fidelity version.
NOTE: Desires at the bottom was intentionally left blank. This was due to the customer personas not being made yet (this was going to be Phase 2). This was something that they didn’t want to confirm until they fleshed out the whole process a bit more, since there are lots of potential personas.
High fidelity
After getting approval from my project members I started work on the high-fidelity version. I created it within Adobe Illustrator because I have the most experience with it and it allowed for easy iteration. As you can see there are slight differences from the sketch to the image.
.jpg)
Hi-Fi Journey Map
Validation
Presentations
Digital Marketing
After finishing the high-level journey map, Rebecca and Julio felt this was a good point to end Phase 1 of this project. So, we about creating a power point to present to our digital marketing team (roughly 10 people). Since Rebecca and Julio knew the ins and outs of the data much more than me, they presented those findings, while I presented the process of the journey map.
We got great feedback from the team and this map really showed how complicated the mortgage process can be, even to those who have been in the industry for a bit.
Marketing Directors
Not to long after presenting our findings to our immediate team, our manager and project team presented it some higher ups in the company. I wasn't able to attend the meeting due to having class, but the execs also took a liking to the map as well, hoping that it would be further fleshed out in the future.
take aways
Research takes time
Looking at the project time for this Phase 1, it’s easy to say this took too long. But I can attest that this process is long for a reason. The data found in the first few months laid the groundwork for a multitude of different projects. While this was simply a high-level journey map this can easily turn into user personas, detailed maps, marketing plans, system renovations to make journey easier, and plenty more.
Data Analytics
While the outcome for this project was a journey map. This was more an exercise in data analytics and condensing lots of different points into only the needed ones. This is something that is incredibly vital to UX, considerings lots of the data comes in qualitative form. So, this project greatly helped me to sharpen those skills.
Asking Questions
Mortgages are complicated. As an intern and having zero experience of anything even coming close to a mortgage, I heavily relied on my project members to help explain the details and meanings of lots of the data points. Something that I was hesitant and slightly embarrassed to do at first, but soon realized I needed to ask these questions other wise I won’t be able to put out a good final design.


